Bandwidth Hawk
Despite multiple pressures, 2025 saw an MDU construction spurt. Almost all of it is for rental housing, not owner-occupation.
By: Steven S. Ross, Broadband Communities
Construction of new homes fell by almost 100,000 in 2025 but headwinds facing the home-building industry affected mainly single-family units.
Meanwhile, construction of multiple-dwelling unit (MDU) homes – by far the most cost-effective living spaces for broadband providers to service – increased almost 10 percent from 489,000 in 2024 to an estimated 536,000 in 2025.
Concurrently, construction of single-family homes has decreased. By my estimates, it fell from a three-year high of 1 million in 2024 to only 876,000 last year – a staggering decrease of over 13.5 percent.
That means more than 38 percent of all dwelling units built in 2025 were in large MDUs containing at least five apartments (and usually far more). That’s far above the historical rate.
Well under 30 percent of existing housing is multiple family. Comparatively, that number significantly trails 2022 figures, when 43 percent of all new construction was multiple family.
The final overall numbers for 2025 may be worse.
My predictions are based on data for all of 2024, and for 2025 through October.
Data for the remaining months of 2025 are only my estimate and may have been affected by particularly bad weather nationwide during much of November and December.
Not all of the headwinds were due to bad weather.

Federal Reserve short-term rates dropped only a half percent in 2025, and half of that cut occurred only in December.
In reaction to that, mortgage interest rates barely fell at all until year’s end. Reasons included inflation, the dollar’s value falling against other major world currencies, and stubborn federal budget deficits – about $1.8 trillion as of 2024 (Biden’s last year) and over $2 trillion in the first year of Trump’s second term (2025).
What’s more?
Construction cost increases far outpaced the 2.7 percent general consumer inflation rate. Erratic tariffs disrupted imports of structural lumber from Canada, electrical wiring and other equipment from China, and heating and cooling equipment from Europe (and China as well).
Immigration policy also affected the supply of construction workers. Catastrophic flooding, fires and winds soaked up more resources than normal for repairs to existing housing stock. On the other hand, the expected broadband construction boom due to the Broadband Equity, Access, And Deployment (BEAD) program has yet to start soaking up construction resources.
Despite all of that, however, different regions experienced different growth and decline patterns. The south gained back some of its recent losses, the northeast saw modest gains, The west recovered somewhat from its 2023 slump and only the Midwest saw substantial declines (Figure 1).
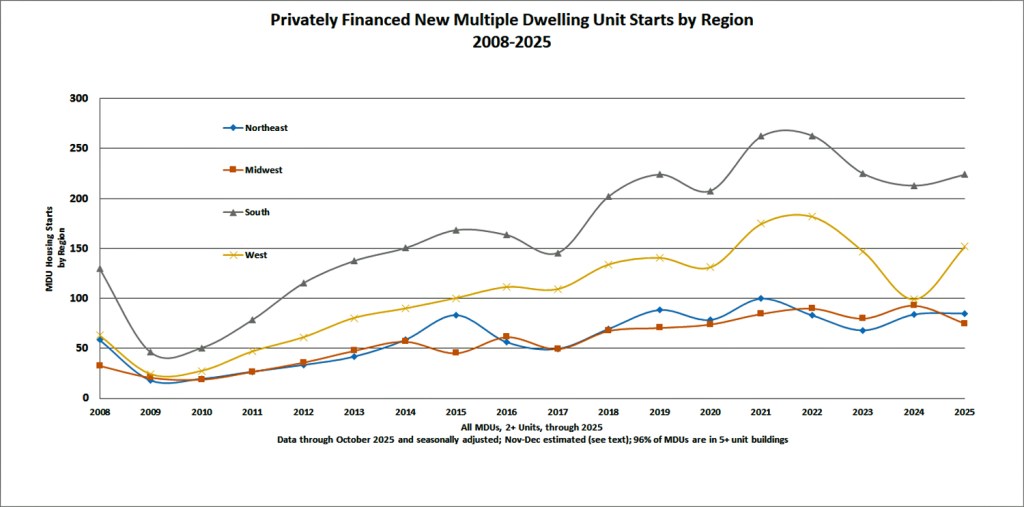
Figure 1
But the steep drop in single-family sales of newly built housing, especially in 2025, while MDU construction was rising, was unusual (Figure 2).

Figure 2
Also, it should be noted that newly constructed housing of all types is shrinking in size, in response to high inflation in building materials.
That, in turn, clashes with longstanding expectations of more work-at-home opportunities. It also clashes (at least in the long run) with a common strategy among young singles these days – unrelated people pairing up to jointly rent a home or apartment.
Thus, broadband deployers’ business plans and expectations have clearly become shakier in the past few years.
Census data does not include expansion or division of existing homes to add dwelling units (a solution pushed by many cities to help cure housing shortages and make communities more sustainable). But, in most jurisdictions, the data does include so-called “backyard” homes on what were once single-family lots.
Looking ahead with permit activity
Is the MDU trend sustainable?
Data on building permits is somewhat muddy but favors more MDU dominance. When I look at the building permits issued in all of 2024 and compare with all the permits issued in the first 10 months of 2025, I see an odd pattern:

Table 1: Comparing 2024 and 2025 permit activity
The total number of housing units covered by newly issued building permits in the first 10 months of 2025 is 82 percent of the total for all of 2024. But the total for single-family homes is 80 percent and for MDUs with at least 5 units, it is 86 percent.
Historically, about 80 percent of all permitted housing actually gets built. It all suggests that MDU construction will, at worst, stay at the current pace, barring a deep recession in 2026.
Where the homes will be
Two downloadable Excel files, one for all of 2024 (Table 2) and the other for the first 10 months of 2025 (Table 3), are here. They are sorted by number of MDUs containing at least 5 dwelling units by metropolitan area, but they include data for all housing.
I’ve also calculated the average number of dwelling units for each region’s large MDUs. Overall, that’s almost 27 units per structure (among MDUs with at least 5 dwelling units).
In the tables, note that the Census has expanded on its “Metropolitan Statistical Area” or “Statistical Area” format.
“CBSA” (Core-Based Statistical Area) is now the umbrella term for MSAs (Metropolitan Statistical Areas) and more rural Micropolitan Statistical Areas (with populations under 50,000).
A CBSA is defined by an urban core and nearby counties from which the core derives commuters and supporting businesses.
Meanwhile, a CSA (Combined Statistical Area) groups two or more adjacent CBSAs with significant commuting ties (a mutual exchange of at least 15 percent of the region’s commuters).
The elevator pitch
Builders and the financial community (increasingly Wall Street and not local lenders) tell me it is still easier and more economically attractive to plan new MDUs than to build single-family homes from their older permit backlog of unbuilt structures. They also continue to expand rental housing stock rather than owner-occupied.
Almost all–95 to 97 percent of new MDU construction–is for rental apartments.

That may be terrible for wealth creation, but it is good for deployers, at least in the short term. Per-customer, MDUs are the least expensive to provide with broadband in the first place, and to service. It is also far easier and faster to close broadband deals with savvy building owners than with HOAs.
Typical costs to pass an apartment door with fiber are usually less than $1,500 and far less than $1,000 in new construction if the building’s network is close to an existing fiber line or within range of good point-to-point wireless.
This allows builders and deployers to consider broadband, even when projected full tenancy might take several years to achieve.
A mixed bag
In recent years, deployed networks can be sold for prices approaching $2,000 per revenue-producing apartment in areas that are economically healthy. Such factors could make financing easier. But the federal push to enable cellular and satellite communications does make some lenders nervous.
As I have noted in the past, The U.S. Census and the U.S. Department of Housing and Urban Development do not report on modifications to older buildings that create more apartments. Small urban dwelling units carved out of large single-family homes are ideal for senior households, single occupants, and young families. Most such buildings are already passed by fiber.
In many states, particularly west of the Mississippi River, significant developments are built in unincorporated areas and then folded into those communities once construction is finished.
Therefore, although the number of units completed nationally tends to be about 7 percent below the number permitted. The number of dwelling units completed is sometimes higher than the national average in a given location.
Steve Ross is editor-at-large and founding editor of Broadband Communities. He can be reached at steve@bbcmag.com.
Get news like this in your inbox. Subscribe to the Broadband Communities newsletter!